Declining Stock and Solid Fundamentals: Is The Market Wrong About RE&S Holdings Limited (Catalist:1G1)?
With its stock down 19% over the past three months, it is easy to disregard RE&S Holdings (Catalist:1G1). However, a closer look at its sound financials might cause you to think again. Given that fundamentals usually drive long-term market outcomes, the company is worth looking at. In this article, we decided to focus on RE&S Holdings' ROE.
ROE or return on equity is a useful tool to assess how effectively a company can generate returns on the investment it received from its shareholders. In other words, it is a profitability ratio which measures the rate of return on the capital provided by the company's shareholders.
See our latest analysis for RE&S Holdings
How Do You Calculate Return On Equity?
The formula for ROE is:
Return on Equity = Net Profit (from continuing operations) ÷ Shareholders' Equity
So, based on the above formula, the ROE for RE&S Holdings is:
11% = S$4.5m ÷ S$40m (Based on the trailing twelve months to December 2023).
The 'return' is the income the business earned over the last year. One way to conceptualize this is that for each SGD1 of shareholders' capital it has, the company made SGD0.11 in profit.
What Is The Relationship Between ROE And Earnings Growth?
So far, we've learned that ROE is a measure of a company's profitability. We now need to evaluate how much profit the company reinvests or "retains" for future growth which then gives us an idea about the growth potential of the company. Generally speaking, other things being equal, firms with a high return on equity and profit retention, have a higher growth rate than firms that don’t share these attributes.
A Side By Side comparison of RE&S Holdings' Earnings Growth And 11% ROE
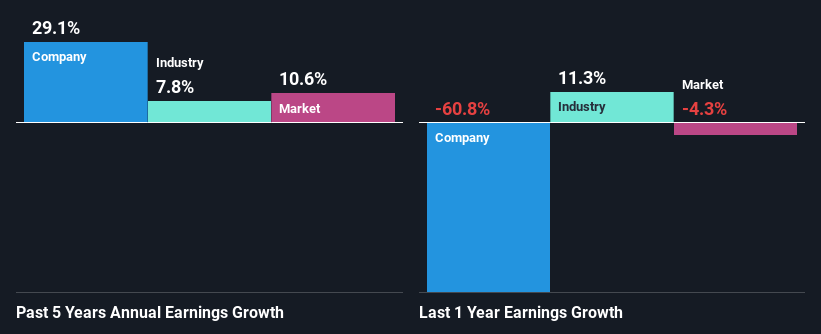
At first glance, RE&S Holdings seems to have a decent ROE. On comparing with the average industry ROE of 7.6% the company's ROE looks pretty remarkable. This probably laid the ground for RE&S Holdings' significant 29% net income growth seen over the past five years. We reckon that there could also be other factors at play here. For instance, the company has a low payout ratio or is being managed efficiently.
Next, on comparing with the industry net income growth, we found that RE&S Holdings' growth is quite high when compared to the industry average growth of 7.8% in the same period, which is great to see.
Earnings growth is an important metric to consider when valuing a stock. It’s important for an investor to know whether the market has priced in the company's expected earnings growth (or decline). This then helps them determine if the stock is placed for a bright or bleak future. If you're wondering about RE&S Holdings''s valuation, check out this gauge of its price-to-earnings ratio, as compared to its industry.
Is RE&S Holdings Making Efficient Use Of Its Profits?
RE&S Holdings has a significant three-year median payout ratio of 65%, meaning the company only retains 35% of its income. This implies that the company has been able to achieve high earnings growth despite returning most of its profits to shareholders.
Besides, RE&S Holdings has been paying dividends over a period of six years. This shows that the company is committed to sharing profits with its shareholders.
Summary
Overall, we are quite pleased with RE&S Holdings' performance. Especially the high ROE, Which has contributed to the impressive growth seen in earnings. Despite the company reinvesting only a small portion of its profits, it still has managed to grow its earnings so that is appreciable. So far, we've only made a quick discussion around the company's earnings growth. You can do your own research on RE&S Holdings and see how it has performed in the past by looking at this FREE detailed graph of past earnings, revenue and cash flows.
Have feedback on this article? Concerned about the content? Get in touch with us directly. Alternatively, email editorial-team (at) simplywallst.com.
This article by Simply Wall St is general in nature. We provide commentary based on historical data and analyst forecasts only using an unbiased methodology and our articles are not intended to be financial advice. It does not constitute a recommendation to buy or sell any stock, and does not take account of your objectives, or your financial situation. We aim to bring you long-term focused analysis driven by fundamental data. Note that our analysis may not factor in the latest price-sensitive company announcements or qualitative material. Simply Wall St has no position in any stocks mentioned.
